
Building a microservice platform that is scalable and can handle hundreds and thousands of requests per second is a difficult task even on modern cloud platforms.
There are many challenges in building modern distributed system and monitoring these systems can be particularly tricky. In this post, I’d like to do a deep dive into how we designed a metrics platform that is able to scale, aggregate and feed in to a monitoring solution to support reporting on anything in the system that a developer or operator wants to track.
As our engineers at Webjet build out our distributed services over a global landscape, our recent goal has been to scale these systems linearly so we are able to achieve 30,000 requests per second with latency as low as 2 seconds for each request.
There are several challenges with designing this type of platform. We have had to tackle many of them so far, including:
- Handling high volume of incoming requests and more importantly how to handle socket connections on the platforms edge
- Fanning out connections from the edge to different microservices within the platform. Managing more socket connections!
- Fanning out connections from internal services to external providers from whom we get hotel content from. Handling outbound connections
- Caching
- Contention in network
- Dealing with high CPU tasks
- More importantly and for this post: How do we track each individual request and report on it without adding massive contention to the system. And do this within a reasonable cost!
Our Starting Point
Our starting point was using StatsD. StatsD is a powerful stats aggregation service that got our attention because it’s very simple to deploy and operate. There are many client libraries so it works across multiple platforms.
StatsD is able to track counters, timers and gauges. Counters are important for us to monitor throughput of each microservice, i.e. Requests per Second. Timers are important to track how much time incoming requests, internal and external requests take to complete.
To operate at a very large transaction volumes, we will need a scalable a metrics system. The first problem we faced with our StatsD server was that it became overloaded because it is a single threaded NodeJS server and aggregation on this server was CPU bound, so metrics were dropped.
Our first intentions were to scale the StatsD server, however when you run multiple instances of StatsD, your aggregation will split among these instances and your metrics will become skewed. Folks at Anomaly wrote a great post about three ways to scale StatsD.
To summarise that post, the StatsD community have built a cluster proxy to overcome the scaling issues by using clever hashrings to ensure metrics go to the same StatsD backend and are aggregated correctly. This proxy however becomes the new bottleneck so to overcome this you can run a few of these proxies by running one on each host as described in the Anomaly blog post.
A service would make a call to the StatsD proxy on the same host which would pass on the metric to an external host running a StatsD server.
HOST { [Microservice] —> [StatsD proxy] } ——> EXTERNAL HOST{ [StatsD server]}
With our platform, we did not want to couple our infrastructure to the metrics servers. We would prefer the platform to push metrics to an external endpoint and not rely on components running inside our microservice platform. The StatsD proxy would also need to be aware of all the running StatsD servers behind it, therefore scaling is not as simple as increasing a Kubernetes deployment replica value. The proxy would need to be reconfigured to be aware of the new instances as you scale up or down.
Prometheus to the rescue
The core problem with StatsD is that the aggregation happens on the server which you need to scale. Our solution: Move the aggregation to somewhere else. Prometheus is a powerful metrics time series database that allows high performing aggregation. It also uses a “pull” model instead of “push” which means it will reach out to endpoints and scrape metrics, so even at high throughput, it can scrape many endpoints efficiently and does this asynchronously outside of the main request path.
You are probably thinking, “So what happens to StatsD???”
Answer: StatsD-Exporter
The folks at Prometheus have an awesome metrics converter that is lightweight, can be load balanced and deals with the task of receiving StatsD metrics and converts them into Prometheus metrics whilst also allowing Prometheus to scrape them periodically.
This design removes the stress of aggregation at the receiving end so even at high request volume, metrics can flow in at thousands of requests per second whilst being scraped every 5 seconds or so, outside of the main request path.
[Microservice] –> {Load Balancer} –> [StatsD-exporter] <– [Prometheus] <– [reporting]
A microservice would send its statistics using StatsD client to a single endpoint which is load balanced. The stat would hit any StatsD-exporter and would be made available for scraping.
Prometheus will scrape the StatsD-exporter and make the metrics available in its time series database for reporting in Grafana.
Running StatsD-exporters as a Kubernetes pod allows you to scale up easily. Prometheus has Kubernetes service discovery built in, so if configured correctly you can allow Prometheus to use the Kubernetes API to find your StatsD-exporter pods and start scraping them almost immediately when they becomes available.
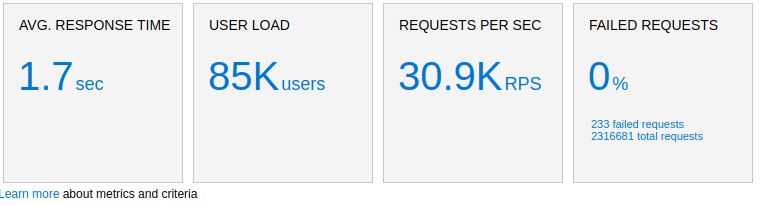
Load testing this solution, we are able to track 30,000 requests per second with a simple F4s series VM in Azure running StatsD-exporter and Prometheus.
From our Azure cloud load testing dashboard we can see our 30 000 requests per second.
These are request counters and timings from the client side :
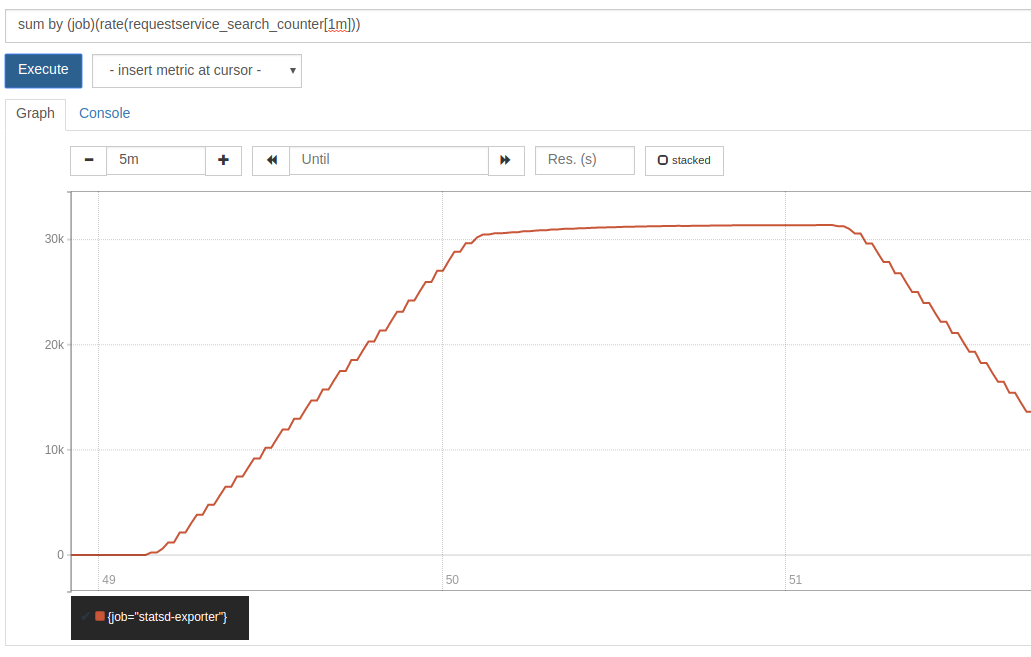
On the backend we can see Prometheus scraping similar values from StatsD-exporter.The goal is to make sure we see the same numbers on the client and server side, so we do not have any discrepancies between the monitoring and the load testing platform.
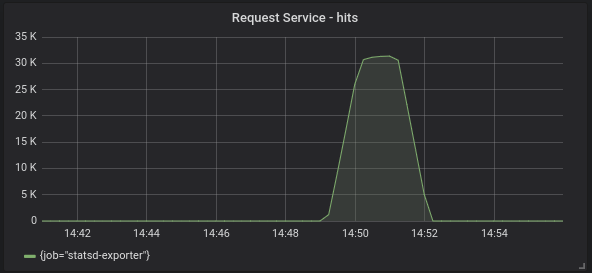
From then onwards, we can feed that data through to Grafana for our monitoring dashboards:
Having a scalable metrics platform like above not only allows us to track things in the microservice world, but also saves a lot of costs. StatsD adds very little client overhead as well as minimal friction in the platform’s network. Since we have full control over how much data we want to keep and archive, we can fine tune the cost model. With most third party offerings, the cost of running hundreds of microservices quickly adds up to a couple of thousand dollars per month because there is a flat fee per gigabyte of data.
We hope this article helps you as an engineer make smarter decisions when deciding on using or building a new scalable metrics system.

No comment yet, add your voice below!